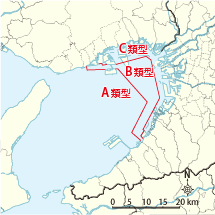
DO(底層)の分布図・経年変化図
底層のDOは、淀川や大和川などの河川が流入する大阪湾の北東側の沿岸部で低く、西側で高い傾向がみられます。
北東側では3mg/L未満の低い値となっています。
本調査結果は、夏季1回の結果であり、調査実施時の気象・海象の状況による影響を受けています。
調査日前に降水量が多く、大規模な出水がみられた平成18年度は、底層DOの低い面積が大きくなっています。
一方、調査日前に強い風が吹いた平成16年度、19年度、平成26年度後半及び令和5年度後半は、底層DOの高い面積が大きくなっています。

| 平成16年度 | 平成17年度 | 平成18年度 |
|---|---|---|
 |
 |
 |
| 平成19年度 | 平成20年度 | 平成21年度 |
|---|---|---|
 |
 |
 |
| 平成22年度 | 平成23年度 | 平成24年度 |
|---|---|---|
 |
 |
 |
| 平成25年度 | 平成26年度(前半) | 平成26年度(後半) |
|---|---|---|
 |
 |
 |
| 平成27年度 | 平成28年度 | 平成29年度 |
|---|---|---|
 |
 |
 |
| 平成30年度 | 令和元年度 | 令和2年度 |
|---|---|---|
 |
 |
 |
| 令和3年度 | 令和4年度 | 令和5年度(後半) |
|---|---|---|
 |
 |
 |
| 令和6年度 |
|---|
 |


