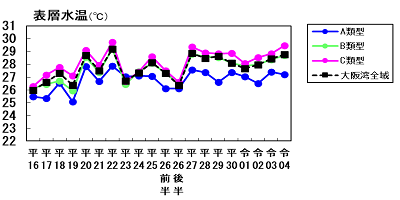
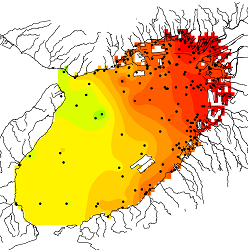
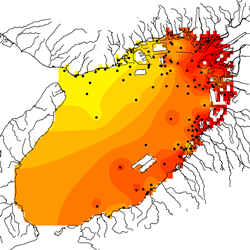
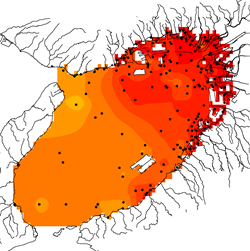
水温(表層)の分布図・経年変化図
表層の水温は、測定時刻、測定水深により値が変動しますが、流れの弱い大阪湾の北東側で高く、西側で低い傾向がみられます。
本調査結果は、夏季1回の結果であり、調査実施時の気象・海象の状況による影響を受けています。
調査日前に気温が高く日照時間の長かった平成20年度、22年度、27年度及び平成28年度は、表層水温の高い面積が大きくなっています。

| 平成16年度 | 平成17年度 | 平成18年度 |
|---|---|---|
 |
 |
 |
| 平成19年度 | 平成20年度 | 平成21年度 |
|---|---|---|
 |
 |
 |
| 平成22年度 | 平成23年度 | 平成24年度 |
|---|---|---|
 |
 |
 |
| 平成25年度 | 平成26年度(前半) | 平成26年度(後半) |
|---|---|---|
 |
 |
 |
| 平成27年度 | 平成28年度 | 平成29年度 |
|---|---|---|
 |
 |
 |
| 平成30年度 | 令和元年度 | 令和2年度 |
|---|---|---|
 |
 |
 |
| 令和3年度 | 令和4年度 | 令和5年度(後半) |
|---|---|---|
 |
 |
 |
| 令和6年度 | 令和7年度 |
|---|---|
 |
 |